


Results & Highlights
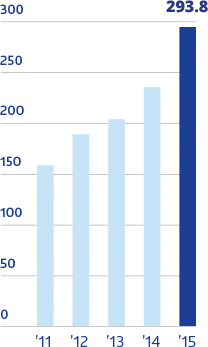
Revenue
($)
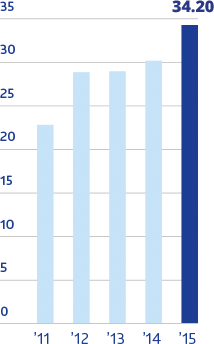
Underlying
Cash NPAT
($)
Gross
Receivables
($)
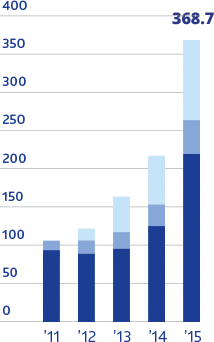
Commercial Leasing
Consumer Leasing
Consumer Rentals
EPS
& DIVIDENDS
(cents)
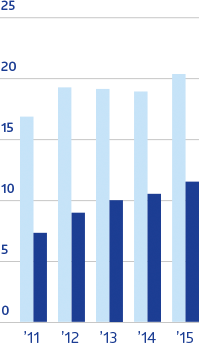
Basic Earnings Per Share
Dividends Paid Per Share
FINANCIAL HIGHLIGHTS
REVENUE
UP
$293.8M
25.1%
Underlying cash NPAT
UP
$34.2M
13.6%
Reported NPAT
UP
$30.6M
8.5%
Group Receivables Up To
68.1%
$368.7M
Roe
Return on equity
Return on equity
18.9%
FULL YEAR, FULLY
FRANKED DIVIDEND
FRANKED DIVIDEND
11.75¢
OPERATIONAL HIGHLIGHTS
- Record installations and earnings in consumer leasing
- Consumer finance building receivables strongly across all loan products
- Significant organic growth in commercial finance
- Strategic acquisition of cash resources australia
- Diversification strategy producing higher results and strong receivables growth